Visualize the count, unique count, averages, sum, maximum and minimum of responses in your database
To use the number visualization tool:
- Select the Number widget in the top bar
- Select which dataset you would like to visualize, on the right-hand panel
- Choose a field in your form
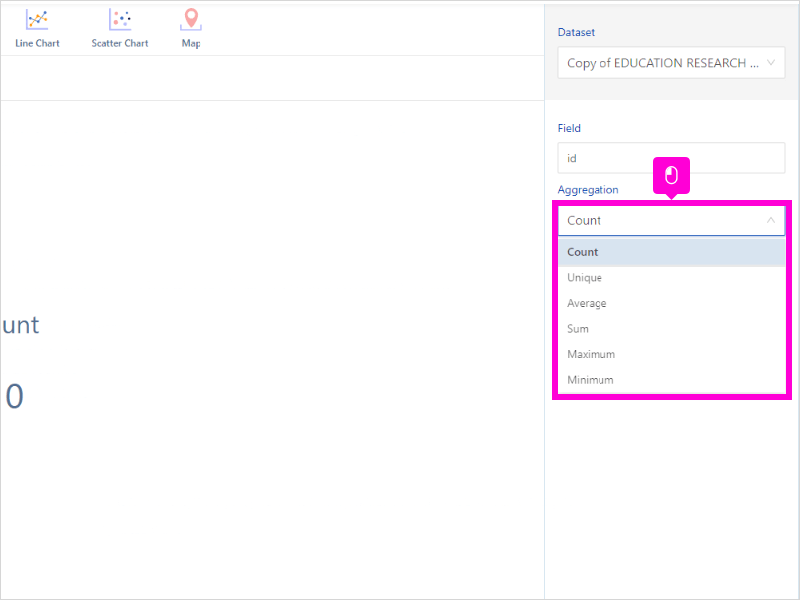
- Choose the aggregation type: count, unique count, average, sum, minimum and maximum
11 STEPS
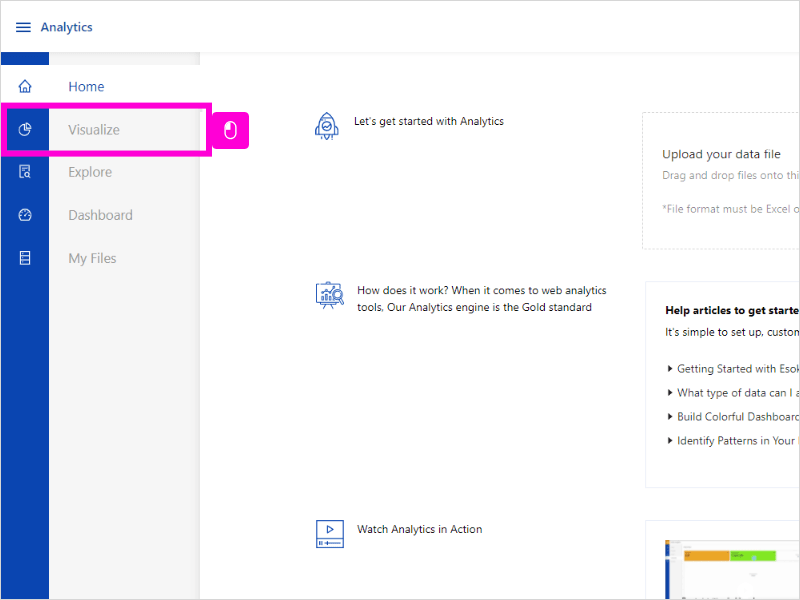
1. The first step is to open Insyt Analytics and click Visualize
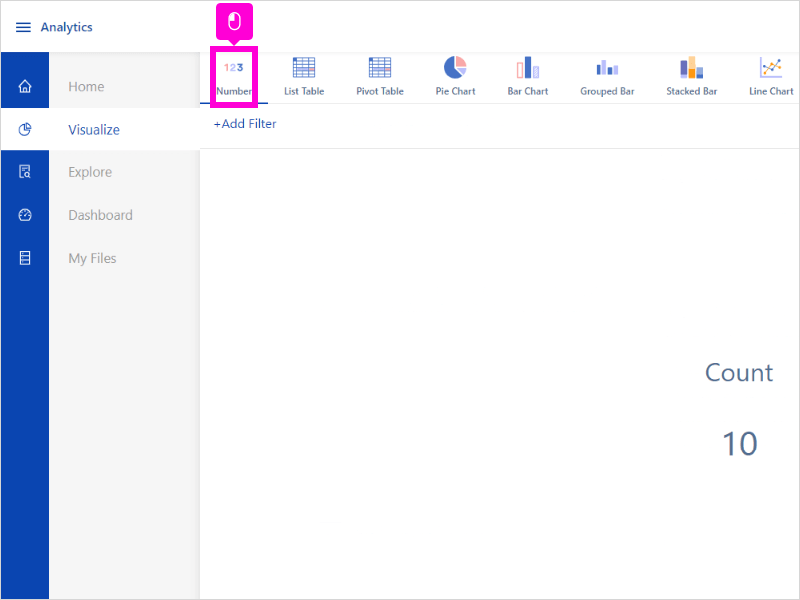
2. Click Number
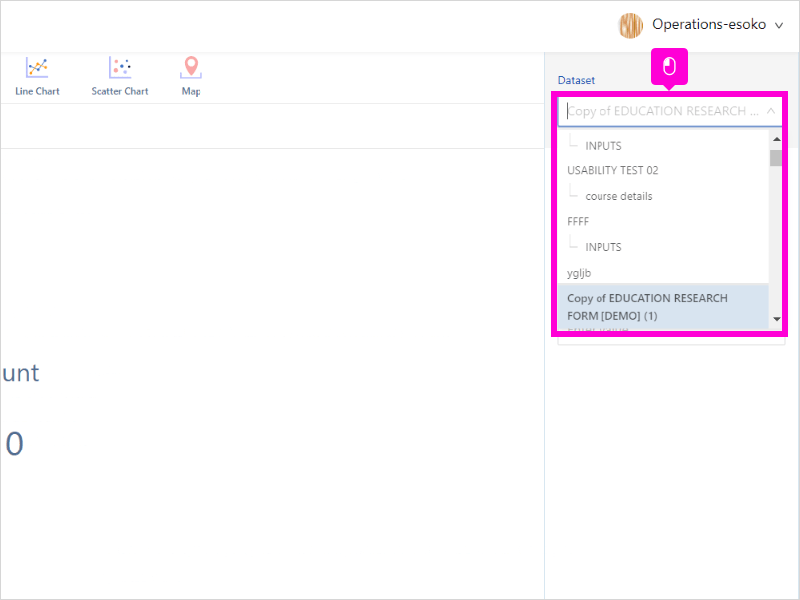
3. Under Dataset, select your dataset. Datasets are sourced from forms created on Insyt or those uploaded.
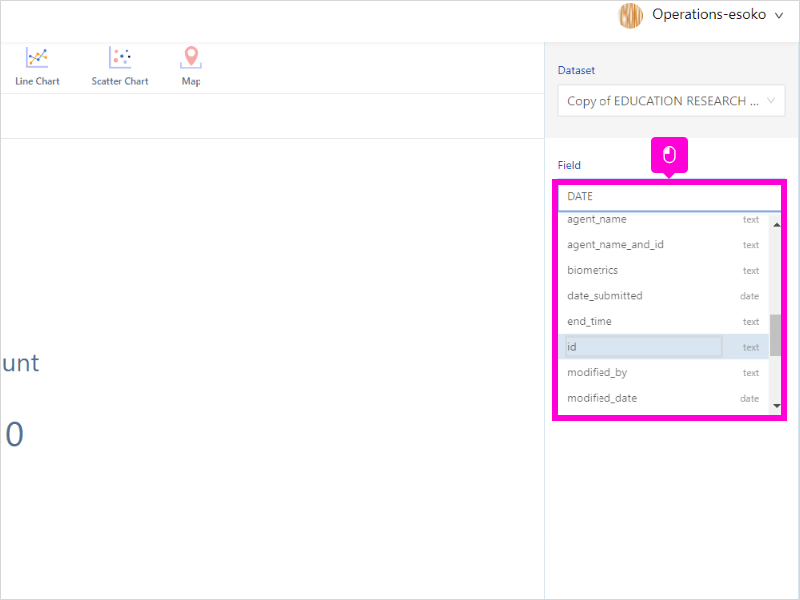
4. Under Field, choose the field you want to visualize.
5. Under Aggregation, select the aggregation type: count, unique count, average, sum, minimum and maximum
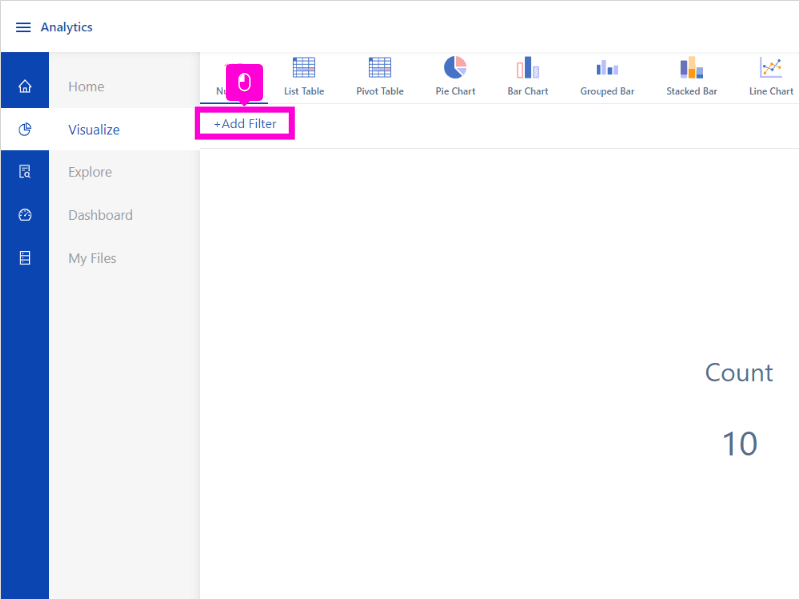
6. Click + Add Filter to add additional filters, if necessary.
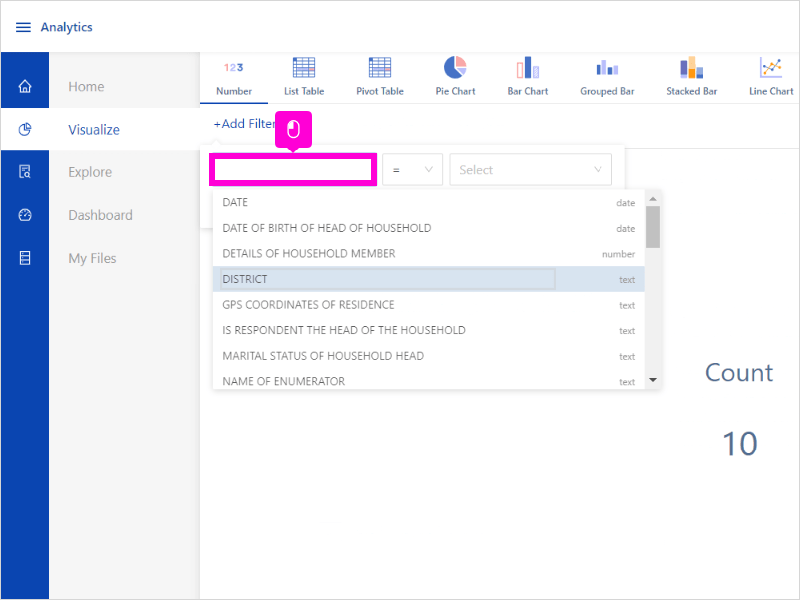
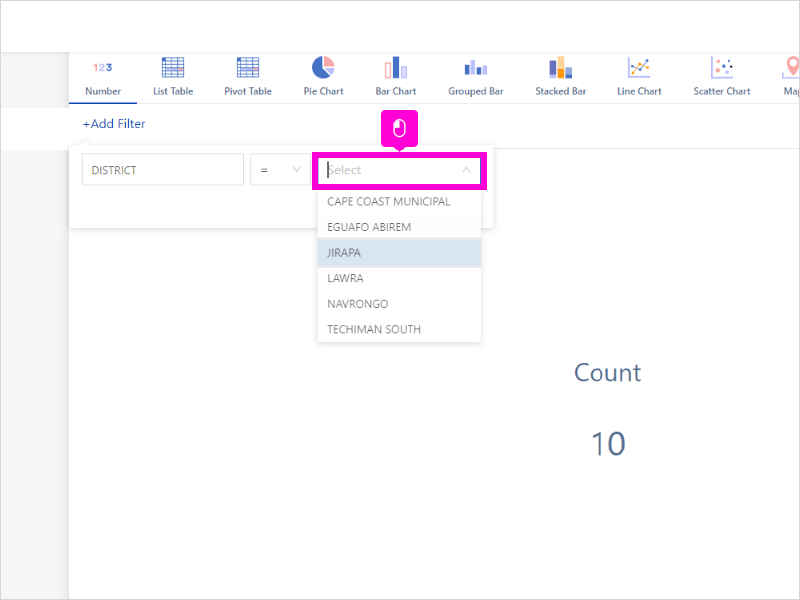
7. Select a field to filter by
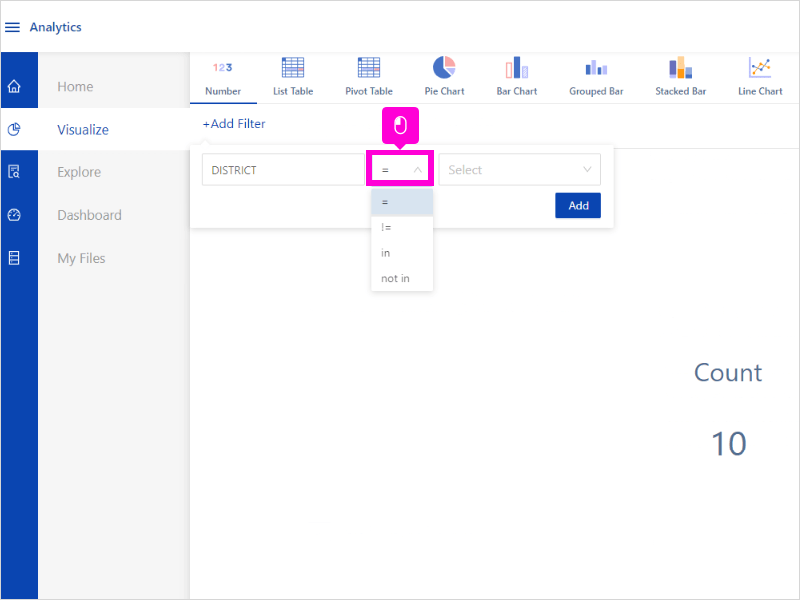
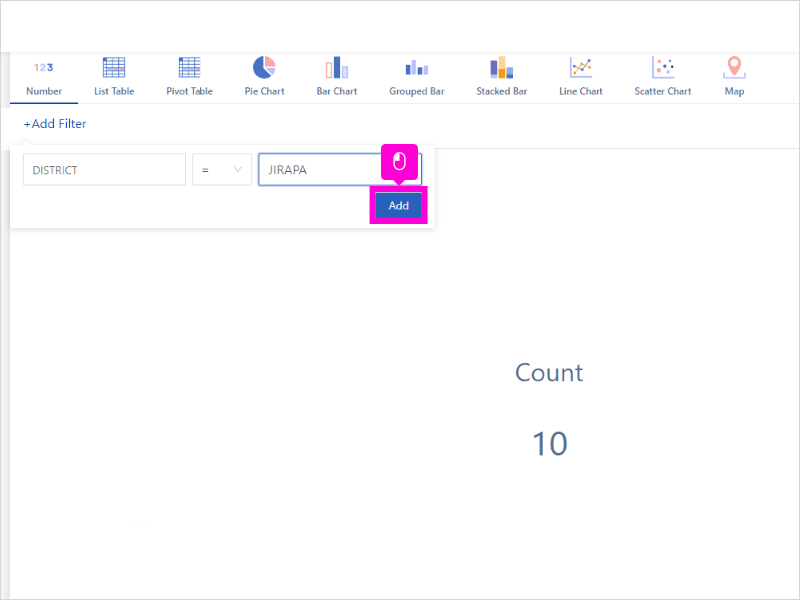
8. Select the rule
9. Select the response to filter by
10. Click Add
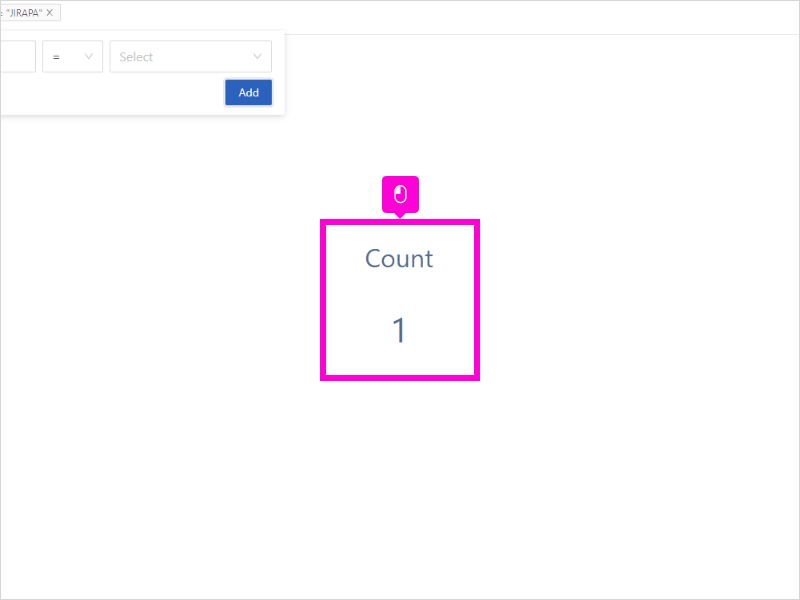
11. Display is updated
Here’s an interactive tutorial
** Best experienced in Full Screen (click the icon in the top right corner before you begin) ** https://www.iorad.com/player/1945803/Analytics-Esoko—How-to-visualize-Number
Was this article helpful to you?
Yes
No