Map widgets enable you to visualize GIS coordinate and GPS polygon responses on an interactive map.
6 STEPS
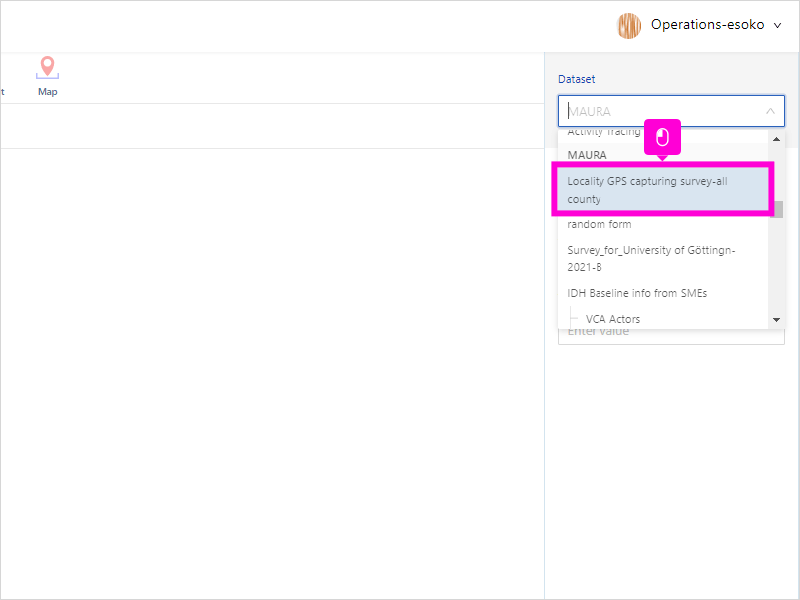
1. Select your dataset
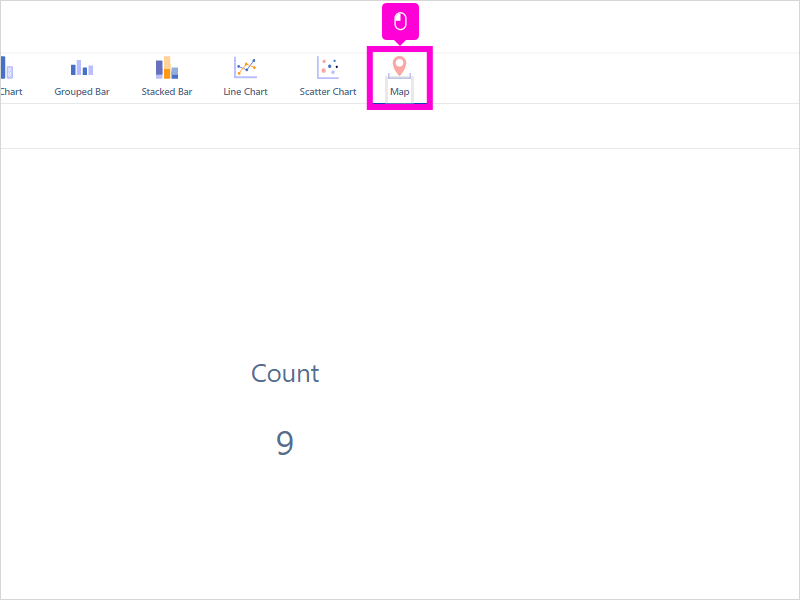
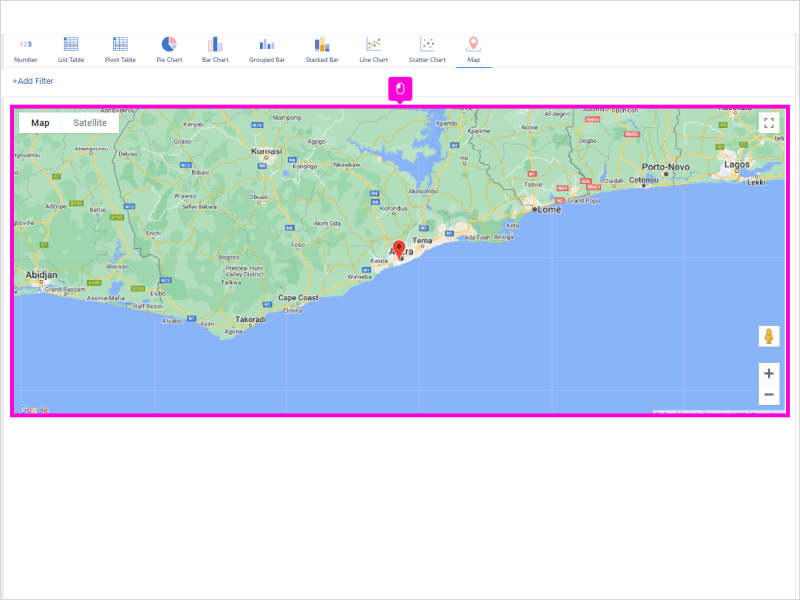
2. Click Map
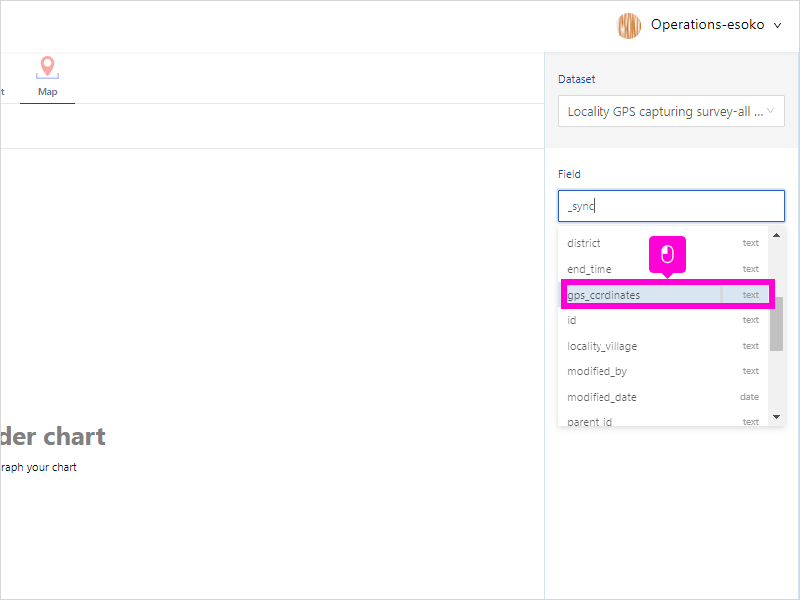
3. Enter the GPS related field you want to visualize. This will either be GIS coordinate or GPS polygon question type.
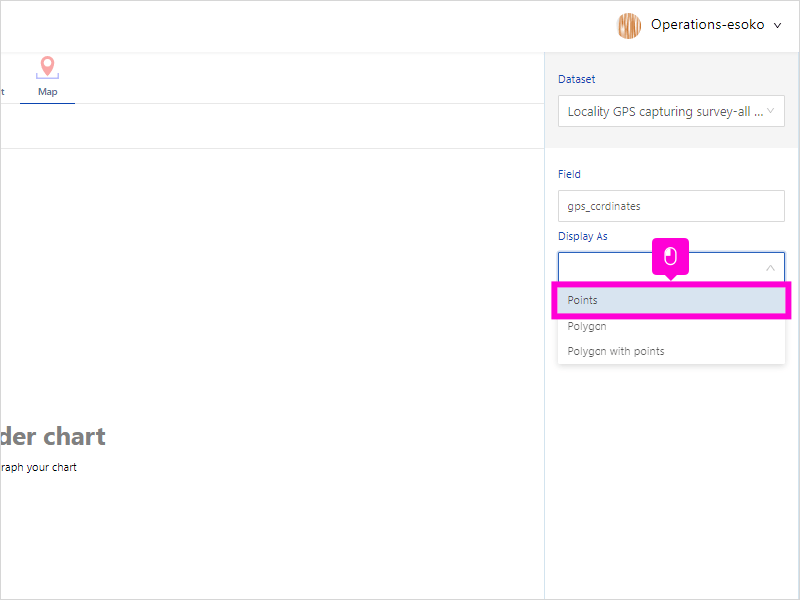
4. Depending on whether your field is a GIS coordinate or GPS polygon, you can choose to either display as a point or polygon respectively
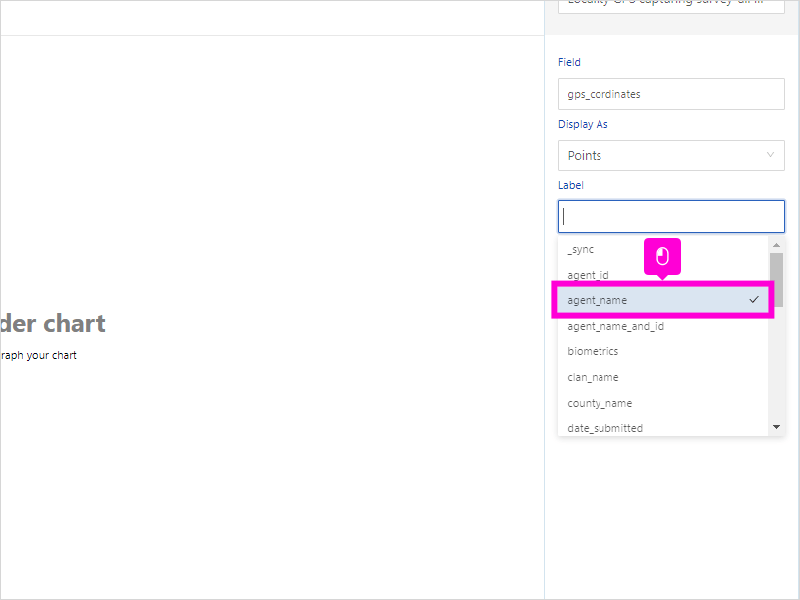
5. Select how you would like to label each point. you can choose multiple fields.
6. Visualize your map response.
Here’s an interactive tutorial
** Best experienced in Full Screen (click the icon in the top right corner before you begin) ** https://www.iorad.com/player/1964051/Analytics-Esoko—How-to-create-map-visualization?iframeHash=watchsteps-1
Was this article helpful to you?
Yes
No