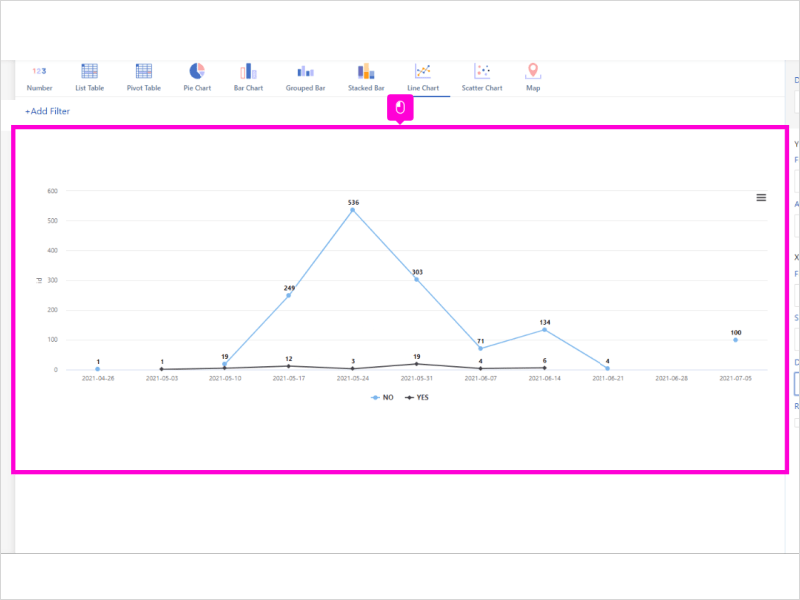
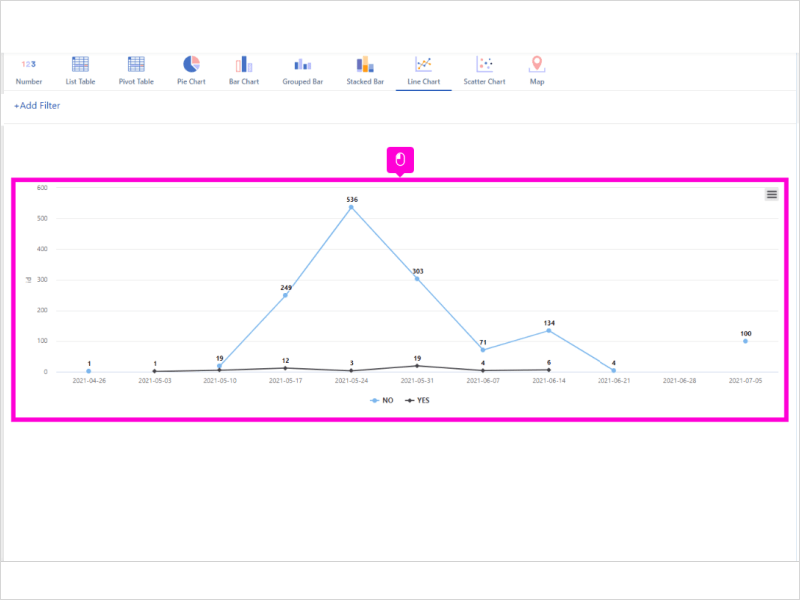
Display information as a series of data points connected by straight line segments.
17 STEPS
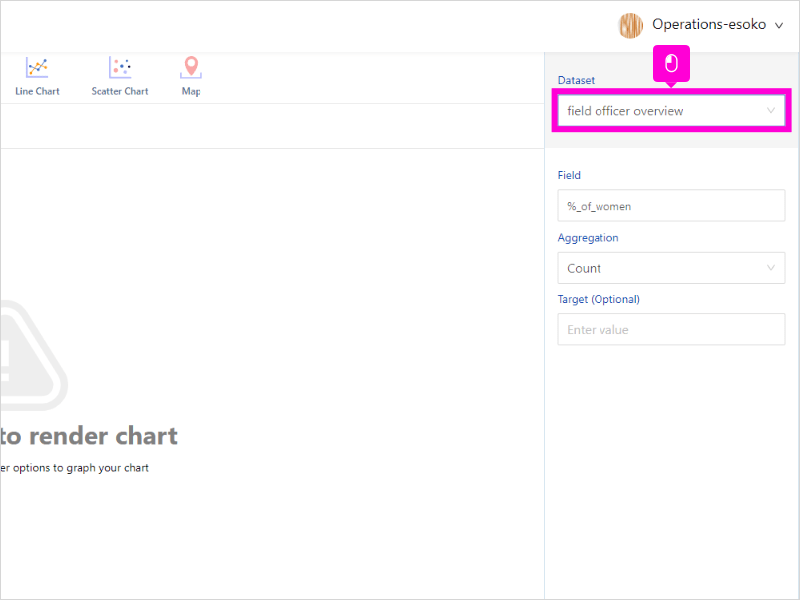
1. The first step is to open Insyt Analytics and click field officer overview
2. Click highlight
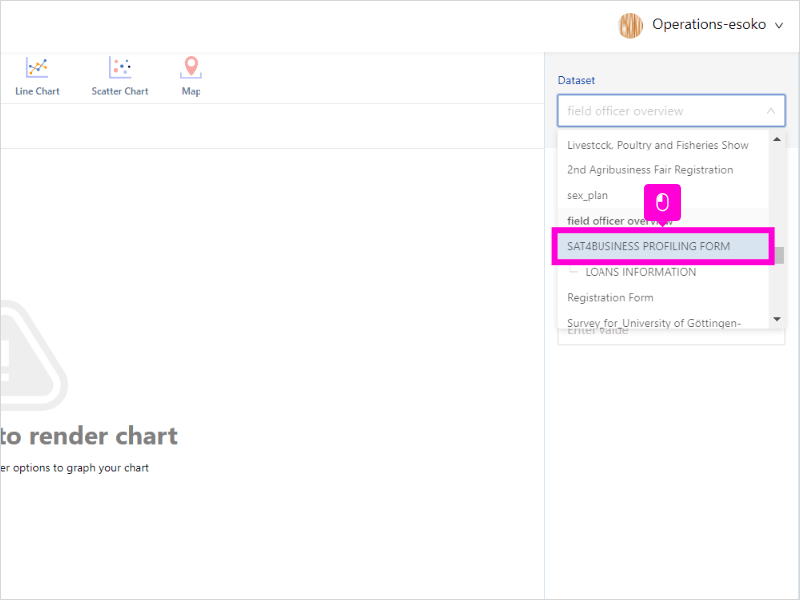
3. Click highlight
4. Click highlight
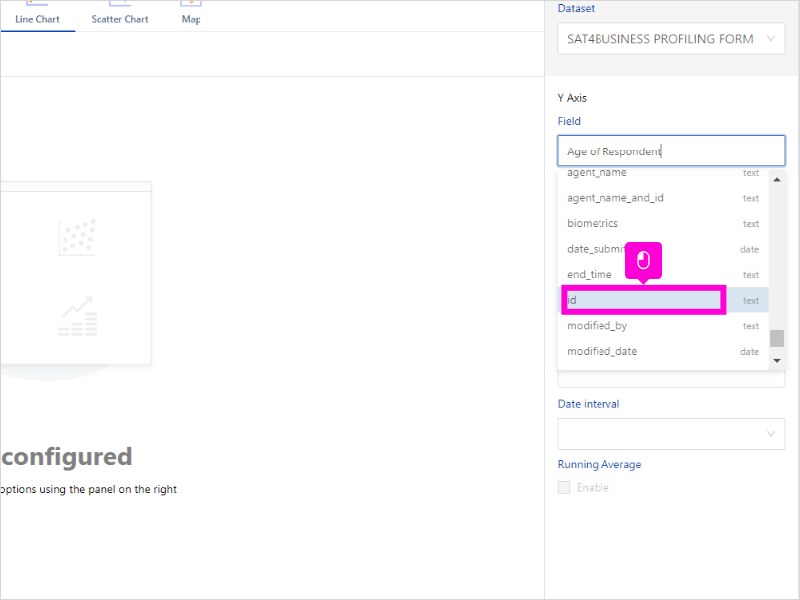
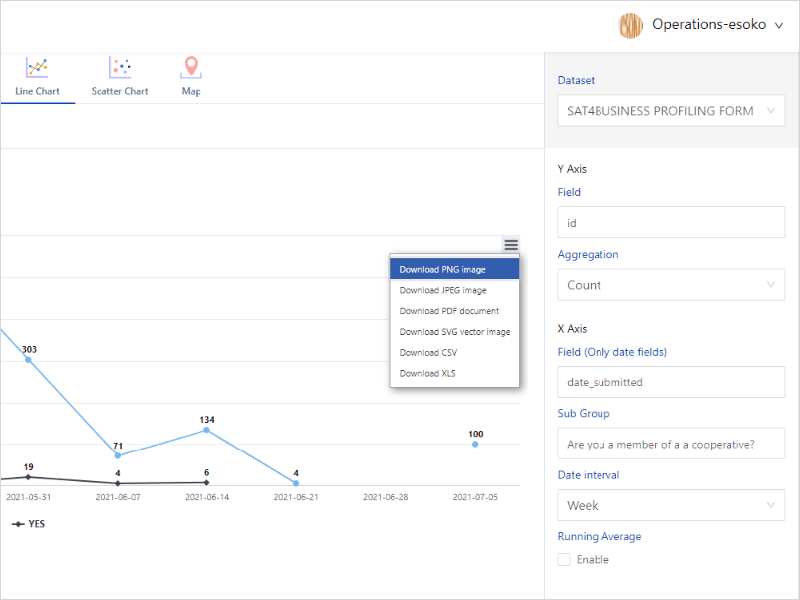
5. Scroll down and click id
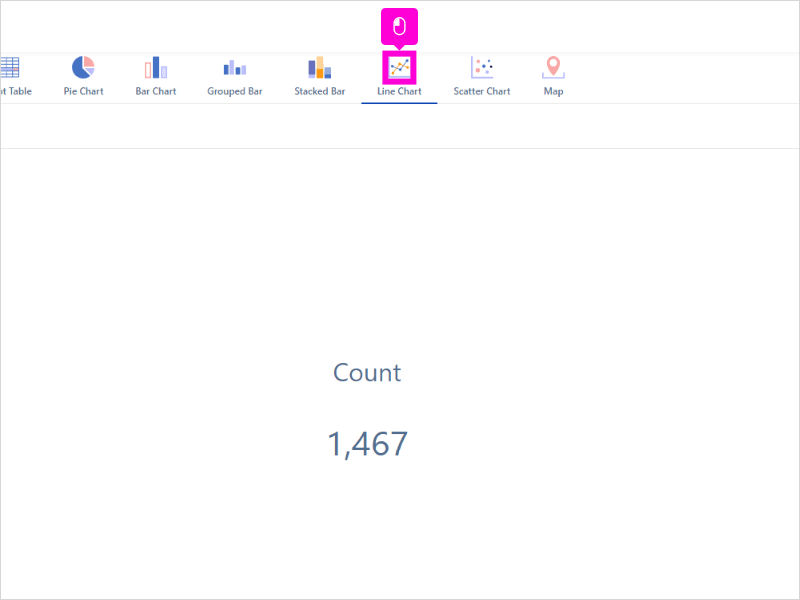
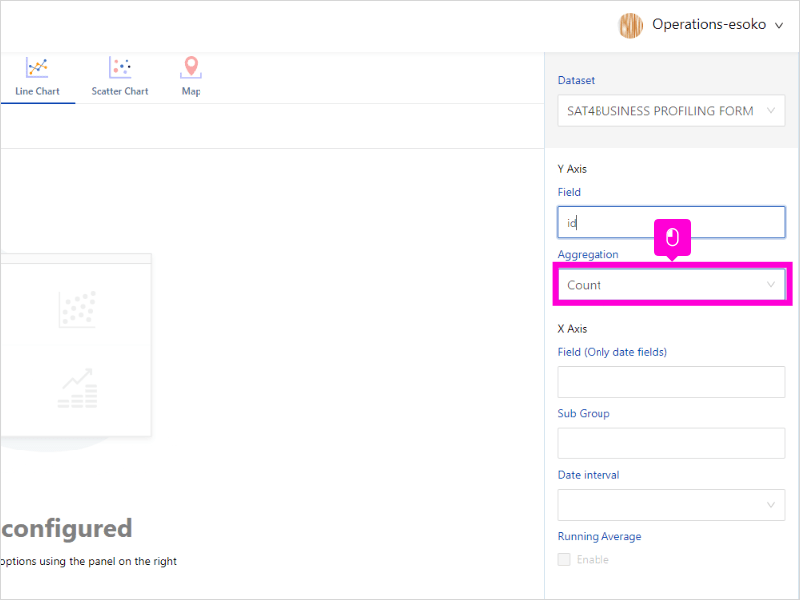
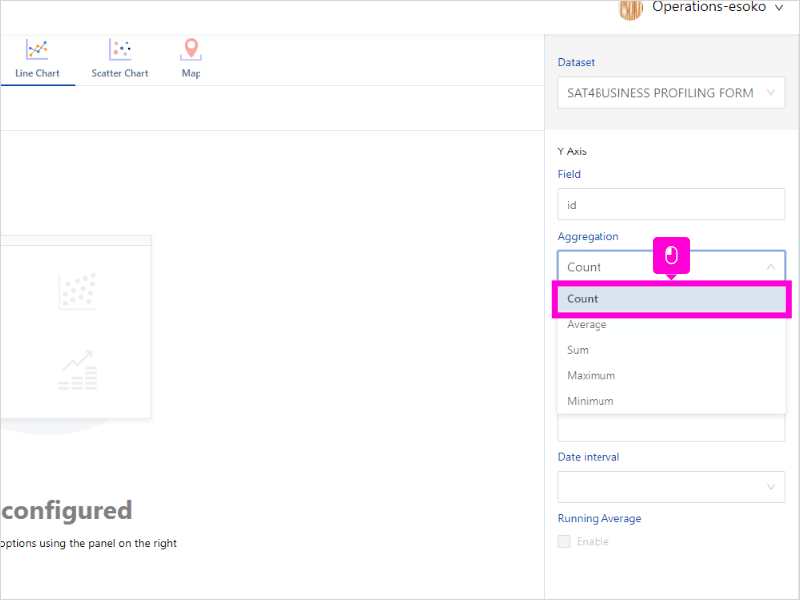
6. Click Count
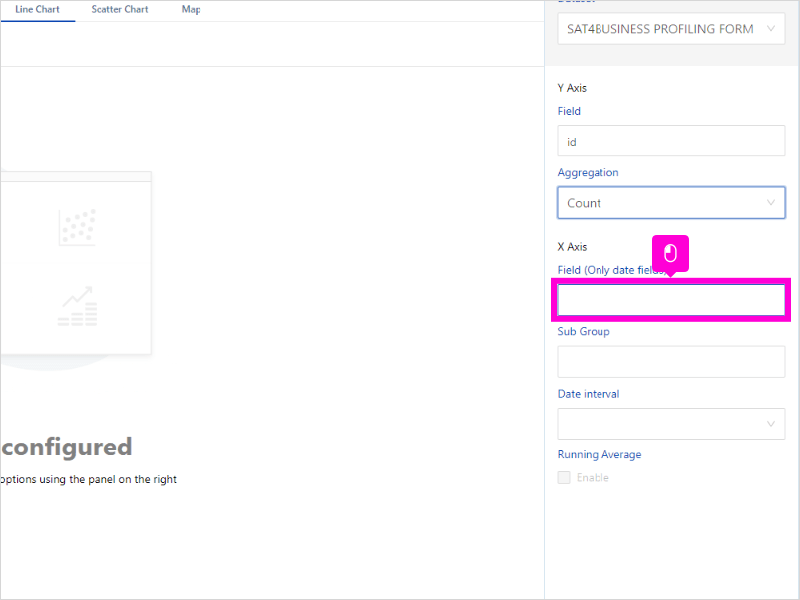
7. Click highlight
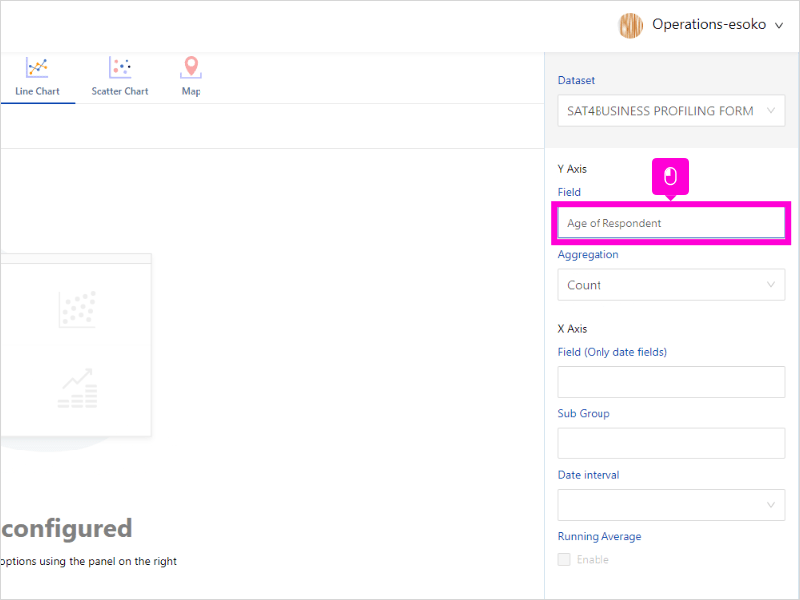
8. Click highlight
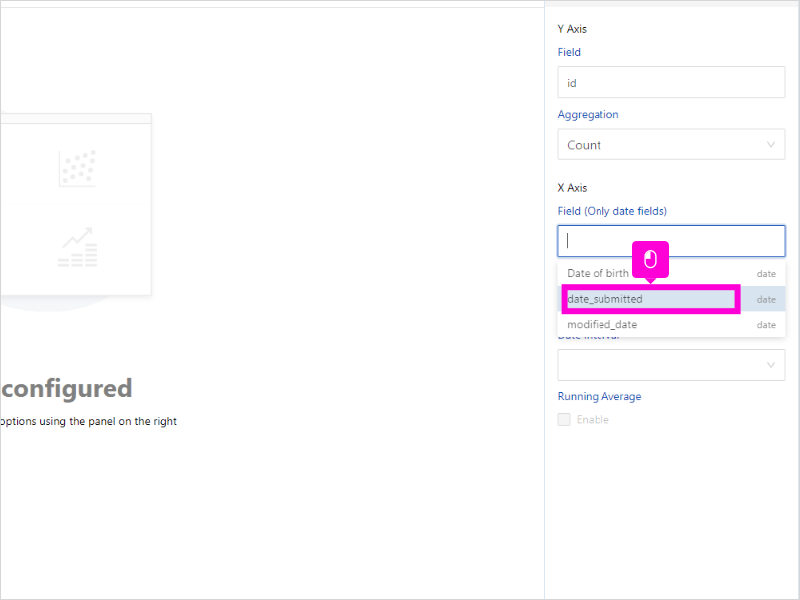
9. Click date_submitted
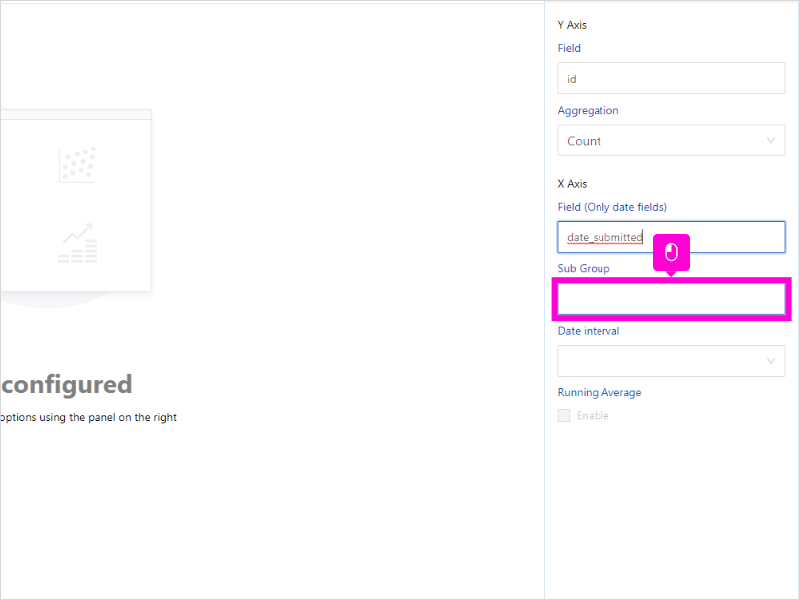
10. Click highlight
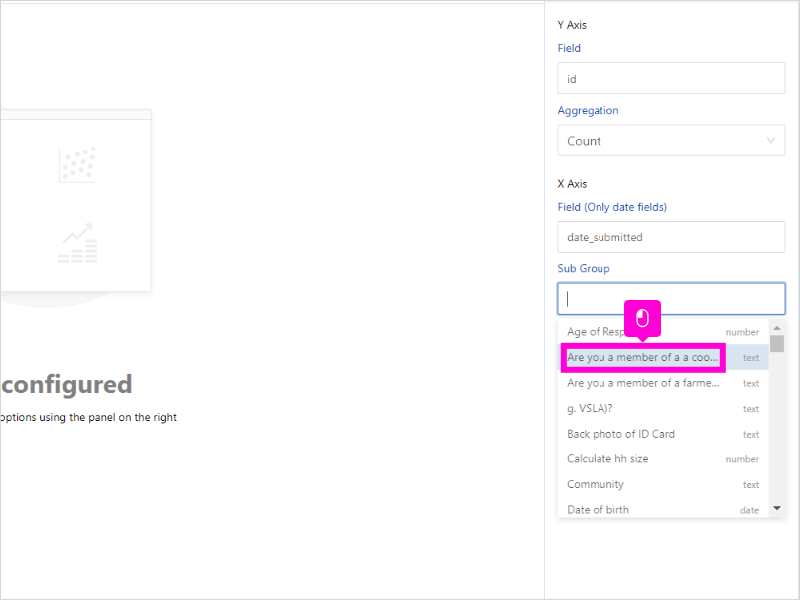
11. Click highlight
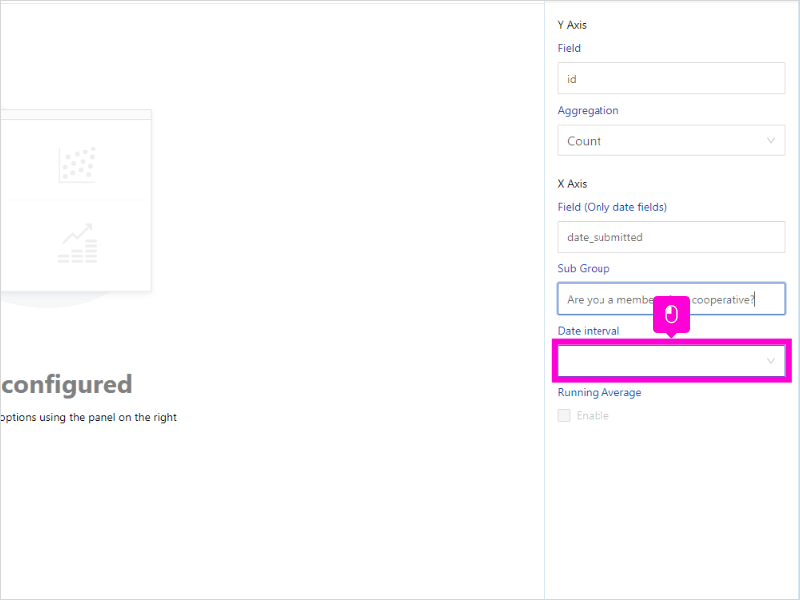
12. Click highlight
13. Click highlight
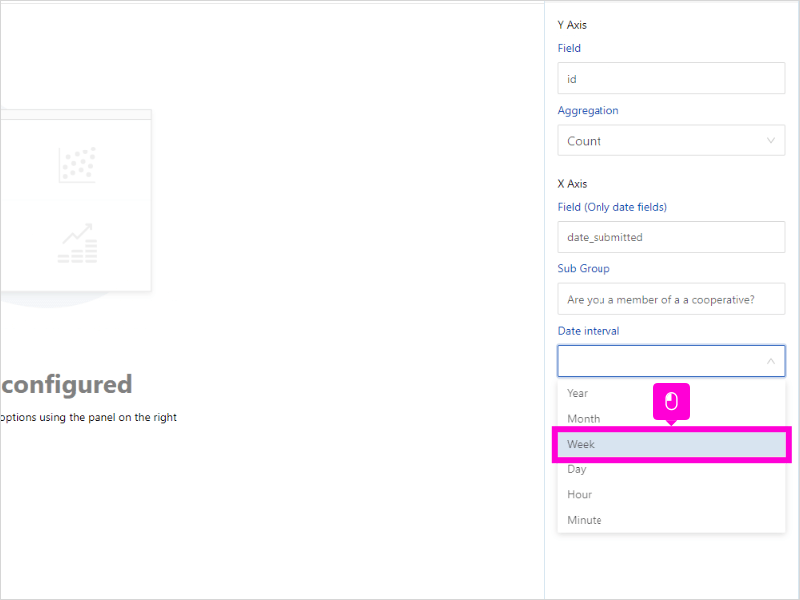
14. Click highlight
15. Click highlight
16. Click Download PNG image
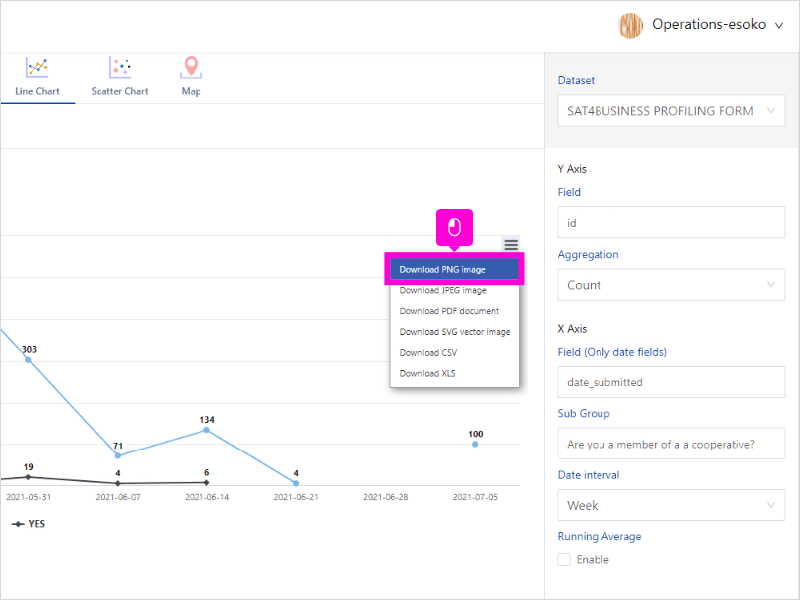
17. That’s it. You’re done.
Here’s an interactive tutorial
** Best experienced in Full Screen (click the icon in the top right corner before you begin) ** https://www.iorad.com/player/1946819/Analytics-Esoko—How-to-create-a-line-graph–wip-
Was this article helpful to you?
Yes
No