Upload Excel or CSV file
The Analytics platform enables you to build reporting dashboards around existing data sets you may have from previous projects.
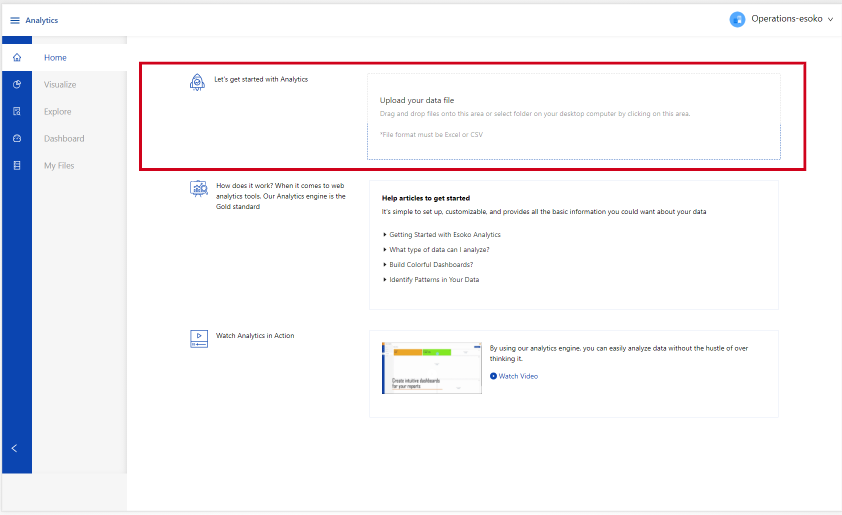
On the home page:
- Drag and drop your file in the “Upload your data file” section or
- Click on the area, select your data file (excel or CSV) from your PC folders and click open
- Explore smart data analytics in the Visualize section of the platform using a range of widgets – number, pivot table, pie chart, bar chart, grouped bar, stacked bar, line chart and scatter chart